
What each chart is looking at
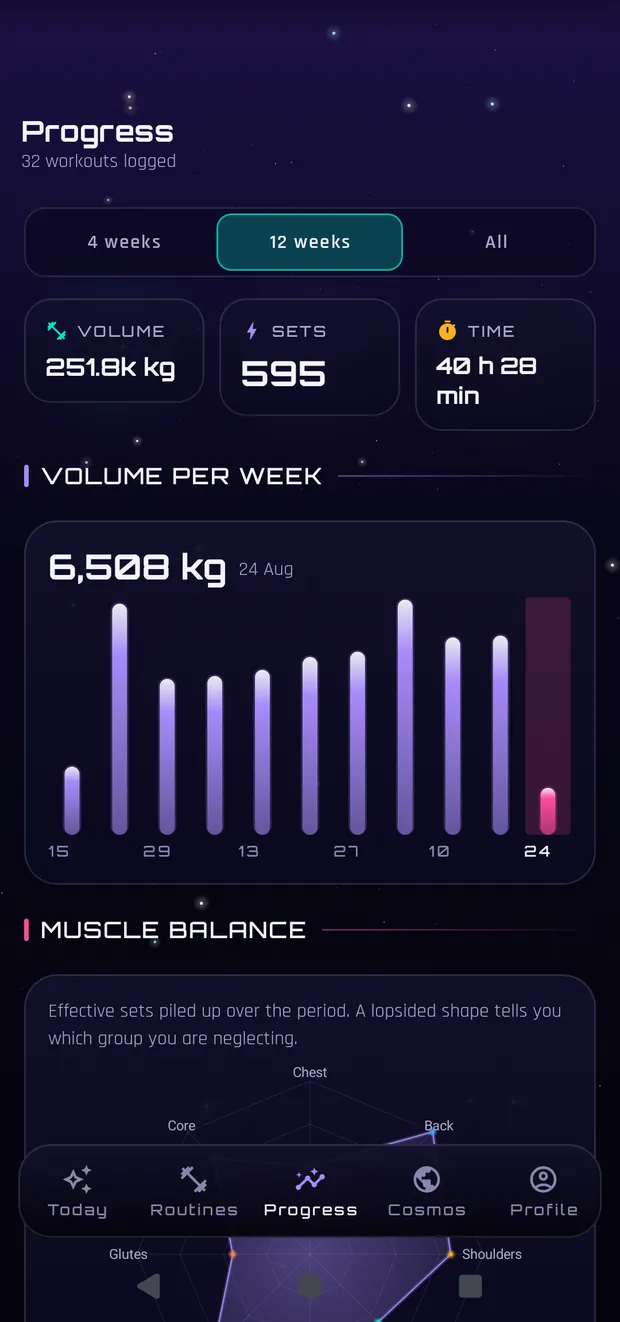
Progress has six things and each answers a different question.
The period drives everything
At the top you pick 4 weeks, 12, or all. That selector recalculates everything below: volume, sets per muscle and the period's records. It opens on 4 weeks because that is the window you recognise yourself in; with «all» you get the months before you used the app.
Volume: the kilos you moved
Weight times reps, adding up every working set. It is for comparing your weeks against your own, not against anyone. On two-dumbbell exercises it counts both, so a dumbbell press with 30s for 10 reps is 600 kg, not 300.
Relative strength and estimated 1RM
The estimated 1RM comes from your best set using the Epley formula, and it is a guide: you do not need to attempt a true max to know whether you are going up. Relative strength puts it against your bodyweight, which is what lets you compare last year's bench with today's if your weight changed.
Balance, consistency and the weakest link
Muscle balance counts effective sets per group over the period: a very lopsided shape is a warning, not a grade. The consistency map is the calendar of the days you trained. And «weakest link» points at the group you have been neglecting, which is almost always the one you do not look at.
More on How the app works
The first five minutes
Pick a plan, train, see what happens at the end. That is all.
Inside the workout screen
The one you will use most, and the one hiding the most.
Routines, programs and other people
What each one is, where they come from, what sharing actually sends.
Cosmos: what is shared and what is not
Box by box, and what never leaves even if you tick everything.
Your data: cloud, backups and importing
Where your history lives, how to get it out, how to bring it in.
This is general information written from the training literature, not medical advice or a personalised plan. If you take medication, have a health condition or something genuinely hurts, the person to ask is a healthcare professional.